For every decision support system, it is important that the data model chosen parallels the business analysts' understanding of the business structure. The model should be in such a way that it hides the technical complexities of an OLTP system(like those in Oracle HRMS/SCM/Financials or in other enterprise applications) and transforms them into a OLAP model that allows analysts to structure queries in the same intuitive fashion as they would ask questions.
Dimensional Model
Dimensional model comprises of a fact table and many dimensional tables and is used for calculating summarized data. Since Business Intelligence reports are used in measuring the facts(aggregates) across various dimensions, dimensional data modeling the preferred modeling technique in a BI environment.
Measures or facts are typically calculated data like dollars value or Sales or Revenue. They correspond to the focus of a decision support investigation.
Dimensions define the axis of investigation of a fact. For example, Product, Region and Time are the axes of investigation of the Sales fact. One such investigation could be a scenario where the user might want to see the Sales(in dollars) for a particular product in a given market over a particular period of time. In this case, we are calculatin the fact(Sales) across three dimensions(Product,Region and Time). In simpler terms I can further say that Dimensions give different views of the facts. The give structure to the otherwise unstructured facts.
Facts Table
A fact table is a table with measures. They must be defined in a logical fact table. Each measure has its own aggregation rule such as SUM, AVG, MIN or MAX. Aggregation rules define the way by which business would like to compare values of a measure.
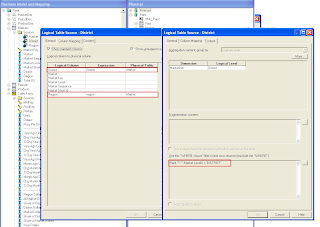
In OBIEE, while defining the Business Model and mapping, we can define the aggregation rule on Fact columns/tables. I'll discuss this later as OBIEE has lots of rules defined on the use of aggregation rules. The following picture shows how Sales Fact table is joined in a One-t0-Many relationships with other dimension tables.
Dimension Tables
A business uses facts to measure performance by well established dimensions. Every dimension has a set of descriptive attributes. Dimension tables contain attributes that describe business entities. For example, the Customers dimension can contain attributes like Region, Subregion, Country, State, Customer.
Dimension Hierarchy
A hierarchy is a set of parent-child relationships between attributes within a dimension. These hierarchy attributes, called levels, roll up from child to parent, for example, Customer totals can roll up to Subregion totals which can further rollup to Region totals. A better example would be daily sales could roll up to weekly sales, which further rollup to month to quarter to yearly sales. A sample hierarchy in OBIEE is shown below
There are two database model schemas that use the dimensional model. They are 'Star' and 'Snowflakes' . Ill talk about the 'Star' schema(preferred schema) in later articles.


