Friday, February 20, 2009

Dissecting Paint Repository

The other day I was trying to re-create the Paint repository shipped by Oracle. I had done a similar process for 'SH' (Sales History) repository and it was pretty simple. But while building 'Paint' repository, I learnt quite a few new things.  I'll go through some of the important things that will help understand how Paint repository works.

XML file as Source Database

The 'Paint' repository has the data shipped in a list of XML files. The XML files can be located in {OracleBI}\server\Sample\paint
  • Market
    This XML(or rather Table) has a column called LevelX which determines whether the other attributes present in the row describe a 'Region','District' or 'Market'. The hierarchy being Region -> District -> Markets where Markets corresponds to the lowest granular level dimension.
  • Period
    This XML also has a column called LevelX which determines whether the row describes the Time dimension 'Week','Month' or 'Year'. The hierarchy being Year -> Month -> Week with Week being the lowest granular level dimension.
  • Product
    This too has a column called 'LEVELX' which determines whether the row describes a Product Type, Brand or UPC. 
  • Fact
    This XML corresponds to the Fact table. Unlike other Fact tables that store measures at the lowest granular level, this table also has pre-aggregated measures stored at 'Region','Brand' and 'Month'.
  • Forecast
    This XML stores the Forcast Facts used for reporting purposes 
Dimensional Tables in Business Model

Paint repository has a total of three dimensional tables in its Business model. They are 'Markets', 'Periods' and 'Products'.  When we carefully examine source for the them, we can see that instead of having one instance of respective source tables, each of them have 3 instances as shown in the picture below. 


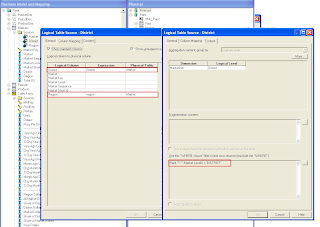
Let us dissect Markets dimension. In the Business model, the Markets Logical table(dimension) is made up of three instances of the physical table Market. The difference between each of this instances(Market, District, Region) could be found under 'Column Mapping' and 'Content' section of the Properties tab.

Since 'Market' is the lowest granular level at which facts are stored, all the columns in the Market logical table are mapped to this instance of Market Physical table. To find out when this instance will be invoked by BI server, we need to give a closer look at the Logical Level to which it is mapped. Here it is mapped to 'Market Key'. This means that whenever an user selects the 'Market' column, this partiuclar instance will be invoked.

Also, in 'Content' section we can see the optional where clause restricting to retrieve only rows at 'MARKET' level. The condition added in the where clause is 
Paint.""."".Market.LevelX='MARKET'


                         Fig.1 Market

Since 'District' is the next logical level in hierarchy, we will take a look at the 'District' instance. To identofy a District, it is must for us to know the 'Dsitrict' and the 'Region' it belongs to. All other columns(which are related to Market) are not required. Hence we see that in this instance, 'District'and 'Region' columns are mapped while all the other columns are unmapped. 'District' is the Logical Level to which this instance is mapped. Hence whenever an user selects the 'District' column in the presentation layer, this instance of the Market(physical table) will be invoked. THe following where clause is added in it to retrieve only Districts.

Paint.""."".Market.LevelX = 'DISTRICT'


                         Fig.2 District

Similarly, the Region instance is also mapped. 

In the next blog, I will talk about how Dimension Hierarchy is built for this repository. I will also talk about how to use Calculation wizard to create some calculated columns in Business Model.

Monday, February 16, 2009

Facts, Dimensions and Dimension Hierarchy

For every decision support system, it is important that the data model chosen parallels the business analysts' understanding of the business structure. The model should be in such a way that it hides the technical complexities of an OLTP system(like those in Oracle HRMS/SCM/Financials or in other enterprise applications) and transforms them into a OLAP model that allows analysts to structure queries in the same intuitive fashion as they would ask questions.

Dimensional Model

Dimensional model comprises of a fact table and many dimensional tables and is used for calculating summarized data. Since Business Intelligence reports are used in measuring the facts(aggregates) across various dimensions, dimensional data modeling the preferred modeling technique in a BI environment. 

Measures or facts are typically calculated data like dollars value or Sales or Revenue. They correspond to the focus of a decision support investigation. 

Dimensions define the axis of investigation of a fact. For example, Product, Region and Time are the axes of investigation of the Sales fact. One such investigation could be a scenario where the user might want to see the Sales(in dollars) for a particular product in a given market over a particular period of time. In this case, we are calculatin the fact(Sales) across three dimensions(Product,Region and Time). In simpler terms I can further say that Dimensions give different views of the facts. The give structure to the otherwise unstructured facts.

Facts Table
A fact table is a table with measures. They must be defined in a logical fact table. Each measure has its own aggregation rule such as SUM, AVG, MIN or MAX. Aggregation rules define the way by which business would like to compare values of a measure.  

In OBIEE, while defining the Business Model and mapping, we can define the aggregation rule on Fact columns/tables. I'll discuss this later as OBIEE has lots of rules defined on the use of aggregation rules.  The following picture shows how Sales Fact table is joined in a One-t0-Many relationships with other dimension tables.


Dimension Tables
A business uses facts to measure performance by well established dimensions. Every dimension has a set of descriptive attributes. Dimension tables contain attributes that describe business entities. For example, the Customers dimension can contain attributes like Region, Subregion, Country, State, Customer. 

Dimension Hierarchy
A hierarchy is a set of parent-child relationships between attributes within a dimension. These hierarchy attributes, called levels, roll up from child to parent, for example, Customer totals can roll up to Subregion totals which can further rollup to Region totals. A better example would be daily sales could roll up to weekly sales, which further rollup to month to quarter to yearly sales. A sample hierarchy in OBIEE is shown below


There are two database model schemas that use the dimensional model. They are 'Star' and 'Snowflakes' . Ill talk about the 'Star' schema(preferred schema) in later articles.

Saturday, February 14, 2009

How to use Samplesales Repository


Samplesales repository is one of the Demo repositories shipped with OBIEE. The data for this repository is based on XML files. Hence, it is not necessary to have a database installed to learn OBIEE(unless you need to create iBots). That makes it more easier for us to setup this repository.

This blog post lists the steps required to make Samplesales the default repository and to set the web catalog for Samplesales dashboard

  • Setting the Repository
    The file 'NQSConfig.INI' has the details of the repository that needs to be initalized when the Server(Oracle BI Server) is started. The file can be located in {OracleBI}\server\Config

    Open the file and edit the line that defaults the repository. The line will look like as shown below

    #Star
    = SH_Local.rpd, DEFAULT

    Modify the line and replace 'SH_Local.rpd' with 'samplesales.rpd'. The line should look like as shown below

    Star = samplesales.rpd, DEFAULT;

    The RPD files that hold the definition of the repository can be located in {OracleBI}\server\Repository

  • Setting Web Catalog
    The BI Presentation Server web catalog contains the report, dashboards, prompts, ibots and so on together with a separate set of users and roles(usually propogated from BI server repository) and their permission on web catalog objects. Unlike BI Server repository, web catalog is stored in a set of XML files, one per web catalog object organized into folders, plus an ATR file per folder that contains the permissions on the objects within them. The files that make up the web catalog are are held in {OracleBIData}\web\catalog.

    Oracle BI Presentation Server uses the file
    'instanceconfig.xml' to initialize the web catalog. This config file has the details about which web catalog to initialize. The config file can be found at {OracleBIData}\web\config

    The XML tag 'CatalogPath' contains the path to the web catalog. Modify the tag to point to web catalog of 'Samplesales' as shown below

    {OracleBIData}\web\catalog\samplesales

  • Setting BI_EE_HOME Repository variable
    The repository file 'samplesales.rpd' has a variable 'BI_EE_HOME' which points to the Oracle BI Home directory. If the path is not correct as per OBIEE installation, modify it to point to {OracleBI} directory.

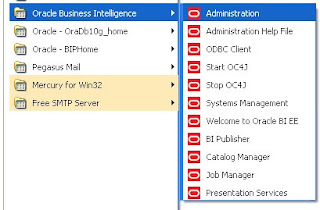
    To set the directory, open Oracle Business Intelligence Administration.


    Click Manage -> Variables 


    Click Repository -> Variables -> Static and modify the variable BI_EE_HOME


Restart 'Oracle BI Server' and 'Oracle BI Presentation Server' and make sure that'Oracle BI Java Host' is running. 'Oracle BI Server' and 'Oracle BI Presentation Server' need to be restarted to load Samplesales Repository and Web catalog respectively.

After restarting login into OBIEE. You should see many dashboards on the Top. In the below image, I have opened '02 History' dashboard.


Notes : -

When OBIEE is installed, it creates two directories, one for the 'Oracle BI Server' with a name 'OracleBI'. Another for 'Oracle BI Presentation Server' callled 'OracleBIData'. 

{OracleBI} -> Location of Oracle BI Home
{OracleBIData} -> Location of Oracle BI Data

Tryst with OBIEE

OBIEE.. My understanding of OBIEE was that it was an extension of BIPublisher with the abilities to create, share, distribute reports in a much easier way. Well, Oracle Business Intelligence Standard Edition was but not OBIEE. And I realized it only after I had installed OBIEE on my laptop.

Installing OBIEE on my machine was a cakewalk. It was not all that complex. I downloaded OBIEE Enterprise Edition v10.1.3.4.0 from Oracle. I also went through Abhinav's post on installation steps. After the installations completed, I was able to login into OBIEE using Administrator/Administrator user name/password. 

The following services get  installed with OBIEE.

  • Oracle BI Server
    Connects to a wide range of relational and OLAP datasources and provides access, via a business metadata layer, to an integrated data set including calculations, aggregations, and KPIs. The default port where this service runs is 9703. 

  • Oracle BI Presentation Server
    Connects via ODBC to Oracle BI Server and provides interactive dashboards, reports, and data visualizations through a consistent, dynamic HTML interface. This default port for this service is 9704. The link used to access OBIEE will refer to this port.

  • Oracle BI Scheduler (Oracle BI Delivers)
    Works alongside Oracle BI Presentation Server to schedule reports and create workflows that perform actions based on alerts and thresholds defined by users. The default port for this is 

  • Oracle BI Java Host
    This service provides presentation services for charts, PDFs and Guages. 

  • Oracle BI Publisher
    This is not a service but a product.  This Provides "boardroom-quality" reports using data sourced from relational databases, Oracle BI Answers requests, Oracle BI Discoverer workbooks, and the Oracle Business Intelligence Enterprise Edition metadata layer
I'll post more articles on OBIEE as I learn more...